Bathymetry and Water Column Correction using 4SM – A HyPhoon user success story

This is part of a series on user success stories that showcase applications and accomplishments using HyPhoon datasets. Send us your story!

The Accomplishment: Dr. Yann Morel derived bathymetry and water column corrected reflectance for Heron Reef using his Self-calibrated Supervised Spectral Shallow-sea Modeler (4SM). Output includes water depth, as shown below, and water column corrected reflectance at the seafloor. Both products are being added to the Heron Reef dataset, and will soon be available for the community to download.

4SM Heron Reef

CASI hyperspectral (left) and 4SM derived bathymetry (right)

Data: The source data used for this success story was the 2002 CASI hyperspectral imagery from the Heron Reef dataset provided courtesy of the Center for Spatial Environmental Research at the University of Queensland. Heron Reef is located at the southern end of the Great Barrier Reef in Australia. The imagery has 1 m pixels and a spectral range from 400-800 nm with 19 spectral bands.

4SM Overview: The 4SM model is based on established physical principles of shallow water optics, operates without need for field data or atmospheric correction, and works with both multispectral and hyperspectral imagery. The model assumes both water and atmospheric conditions are uniform throughout the given scene, requires the presence of both deep water and bare land pixels, and is most applicable to clear shallow water at 0-30 meters depth.

At its core, 4SM utilizes a variant of Lyzenga’s method to calculate the slopes for all bi-dimensional band pairs, which are then used to interpolate diffuse attenuation coefficients for all visible bands. Surface glint is minimized using information from a NIR or SWIR band, bare land pixels are used to derive the slope of the soil line and the water volume reflectance, and deep water pixels are used to approximate deep water radiance. All of this information is then combined to drive an optimization approach for estimating water depth.

Output ultimately includes both water depth and water column corrected reflectance, which can both be used for further habitat and geomorphic analyses.

For more on 4SM: http://www.watercolumncorrection.com/

To access HyPhoon data: http://hyphoon.hyspeedcomputing.com/data-sets/

Satellite-Derived Bathymetry – New products available from DigitalGlobe

DigitalGlobe recently hosted a webinar describing the new bathymetry and benthic products that are being derived using imagery from their WorldView-2 sensor. The methodology uses a set of algorithms developed ‘in-house’ at DigitalGlobe, and while current capabilities show excellent results, plans are already underway to deliver additional improvements.

DigitalGlobe bathymetry

As a quick refresher, WorldView-2 is a high-resolution satellite with 8 multispectral bands at 1.85m spatial resolution and one panchromatic band at 0.46m resolution. Included in the multispectral bands is a new coastal band (400-450nm) that provides enhanced water penetration and hence improved capabilities for aquatic remote sensing. Note that Landsat 8 has adopted a similar approach to band selection, now including a similar coastal band (430-450nm), albeit at the coarser spatial resolution of 30m. WorldView-2 was launched on October 8, 2009 from Vandenberg Air Force Base, and interested users have the option of either ordering archived imagery or scheduling new acquisitions for their particular study area.

The WorldView-2 benthic products include options for water depth, water quality and bottom type classification. Since all three products are inherently interrelated in terms of what the satellite sensor measures, rather than independently derive the individual products, DigitalGlobe utilizes a methodology that resolves all three products simultaneously.

For those interested in specifics, the methodology uses HydroLight to generate a table of surface reflectance spectra based on discrete combinations of water depth, water optical properties and bottom reflectance, and then employs a spectral matching technique to find the simulated spectra that best match the spectra for each measured pixel. The output for each pixel is then assumed equivalent to the parameters used for generating the matching spectra in HydroLight.

The recent webinar focused specifically on output for the water depth product, with example validation results shown for the Bahamas (Lee Stocking Island, Princess Cays and West End), Puerto Rico and St. Croix. In all cases the WorldView-2 output shows strong agreement with acoustic and lidar bathymetry measurements. However, it is noted that accuracy decreases with increasing turbidity, which is to be expected given the inherent physical limitations of this imaging problem (i.e., light needs to be able to penetrate through the water column, reflect off the bottom, and propagate back to the sensor).

DigitalGlobe estimates the following specifications for these products. Water depth is accurate to 10-15% actual depth in clear water over sand to a maximum depth of 20-30m, and accurate to 15-20% actual depth in clear water over dark substrates (sea grass, algae, coral) to a maximum depth of 15m. The other products are still being evaluated, but current indications are that water quality output will be valid to 20-30m in clear water and 5m in turbid water, and bottom classification will be valid to 20m over sand and 15m over dark substrates.

DigitalGlobe bathymetry

Whereas the current technology for these products relies on the spectral domain, future improvements will focus on incorporating the angular and temporal domains. Specifically, this includes taking advantage of WorldView-2 capabilities to obtain multiple sequential views from different angles. This allows calculations of stereoscopic relationships as well as wave kinematics (i.e., wave motion), which can both be used to derive information on bathymetry and thereby improve the product.

If you’re interested in seeing the full webinar: http://digitalglobe.adobeconnect.com/p7g0rab5vr1/

Images supplied courtesy DigitalGlobe.

NASA Takes Over Navy Instrument On ISS

A version of this article appears in the May 19 edition of Aviation Week & Space Technology, p. 59, Frank Morring, Jr.

HREP on JEMEFA hyperspectral imager on the International Space Station (ISS) that was developed by the U.S. Navy as an experiment in littoral-warfare support is finding new life as an academic tool under NASA management, and already has drawn some seed money as a pathfinder for commercial Earth observation.

Facing Earth in open space on the Japanese Experiment Module’s porchlike Exposed Facility, the Hyperspectral Imager for Coastal Oceans (HICO) continues to return at least one image a day of near-shore waters with unprecedented spectral and spatial resolution.

HICO was built to provide a low-cost means to study the utility of hyperspectral imaging from orbit in meeting the Navy’s operational needs close to shore. Growing out of its experiences in the Persian Gulf and other shallow-water operations, the Office of Naval Research wanted to evaluate the utility of space-based hyperspectral imagery to characterize littoral waters and conduct bathymetry to track changes over time that could impact operations.

The Naval Research Laboratory (NRL) developed HICO, which was based on airborne hyperspectral imagery technology and off-the-shelf hardware to hold down costs. HICO was launched Sept. 10, 2009, on a Japanese H-2 transfer vehicle as part of the HICO and RAIDS (Remote Atmospheric and Ionospheric Detection System) Experimental Payloads; it returned its first image two weeks later.

In three years of Navy-funded operations, HICO “exceeded all its goals,” says Mary Kappus, coastal and ocean remote sensing branch head at NRL.

“In the past it was blue ocean stuff, and things have moved more toward interest in the coastal ocean,” she says. “It is a much more difficult environment. In the open ocean, multi-spectral was at least adequate.”

NASA, the U.S. partner on the ISS, took over HICO in January 2013 after Navy funding expired. The Navy also released almost all of the HICO data collected during its three years running the instrument. It has been posted for open access on the HICO website managed by Oregon State University.

While the Navy program was open to most researchers, the principal-investigator approach and the service’s multistep approval process made it laborious to gain access on the HICO instrument.

“[NASA] wanted it opened up, and we had to get permission from the Navy to put the historical data on there,” says Kappus. “So anything we collect now goes on there, and then we ask the Navy for permission to put old data on there. They reviewed [this] and approved releasing most of it.”

Under the new regime NRL still operates the HICO sensor, but through the NASA ISS payload office at Marshall Space Flight Center. This more-direct approach has given users access to more data and, depending on the target’s position relative to the station orbit, a chance to collect two images per day instead of one. Kappus explains that the data buffer on HICO is relatively small, so coordination with the downlink via the Payload Operations Center at Marshall is essential to collecting data before the buffer fills up.

Task orders are worked through the same channels. Presenting an update to HICO users in Silver Spring, Md., on May 7, Kappus said 171 of 332 total “scenes” targeted between Nov. 11, 2013, and March 12 were requested by researchers backed by the NRL and NASA; international researchers comprised the balance.

Data from HICO is posted on NASA’s Ocean Color website, where usage also is tracked. After the U.S., “China is the biggest user” of the website data, Kappus says, followed by Germany, Japan and Russia. The types of data sought, such as seasonal bathymetry that shows changes in the bottom of shallow waters, has remained the same through the transition from Navy to NASA.

“The same kinds of things are relevant for everybody; what is changing in the water,” she says.

HICO offers unprecedented detail from its perch on the ISS, providing 90-meter (295-ft.) resolution across wavelengths of 380-960 nanometers sampled at 5.7 nanometers. Sorting that rich dataset requires sophisticated software, typically custom-made and out of the reach of many users.

To expand the user set for HICO and future Earth-observing sensors on the space station, the Center for the Advancement of Science in Space, the non-profit set up by NASA to promote the commercial use of U.S. National Laboratory facilities on the ISS, awarded a $150,000 grant to HySpeed Computing, a Miami-based startup, and [Exelis] to demonstrate an online imaging processing system that can rapidly integrate new algorithms.

James Goodman, president/CEO of HySpeed, says the idea is to build a commercial way for users to process HICO data for their own needs at the same place online that they get it.

“Ideally a copy of this will [be] on the Oregon State server where the data resides,” Goodman says. “As a HICO user you would come in and say ‘I want to use this data, and I want to run this process.’ So you don’t need your own customized remote-sensing software. It expands it well beyond the research crowd that has invested in high-end remote-sensing software. It can be any-level user who has a web browser.”

Hyperspectral Imaging from the ISS – Highlights from the 2014 HICO Data Users Meeting

The annual HICO Data Users Meeting was recently held in Washington, D.C. from 7-8 May 2014. This meeting was an opportunity for the HICO science community to exchange ideas, present research accomplishments, showcase applications, and discuss hyperspectral image processing techniques. With more than a dozen presentations and ample discussion throughout, it was an insightful and very informative meeting.

HREP-HICO

The HICO and RAIDS Experiment Payload installed on the Japanese Experiment Module (credit: NASA)

Highlights from 2104 HICO Data Users Meeting include:

  • Mary Kappus (Naval Research Laboratory) summarized the status of the HICO mission, including an overview of current instrument and data management operations. Notable upcoming milestones include the 5 year anniversary of HICO in September 2014 and the acquisition of HICO’s 10,000th scene – impressive achievements for a sensor that began as just a technology demonstration.
  • Jasmine Nahorniak (Oregon State University) presented an overview of the OSU HICO website, which provides a comprehensive database of HICO sensor information and data characteristics. The website also includes resources for searching and downloading data from the OSU HICO archives, visualizing orbit and target locations in Google Earth, and an online tool (currently in beta testing) for performing atmospheric correction using tafkaa_6s.
  • Sean Bailey (NASA Goddard Space Flight Center) outlined the HICO data distribution and image processing capabilities at NASA. HICO support was initially added to SeaDAS in April 2013, with data distribution beginning in July 2013. In less than a year, as of February 2014, NASA has distributed 4375 HICO scenes to users in 25 different countries. NASA is also planning to soon incorporate additional processing capabilities in SeaDAS to generate HICO ocean color products.
  • With respect to HICO applications: Lachlan McKinna (NASA GSFC) presented a project using time series analysis to detect bathymetry changes in Shark Bay, Western Australia; Marie Smith (University of Cape Town) described a chlorophyll study in Saldanha Bay, South Africa; Darryl Keith (US EPA) discussed the use of HICO for monitoring coastal water quality; Wes Moses (NRL) summarized HICO capabilities for retrieving estimates of bathymetry, bottom type, surface velocity and chlorophyll; and Curtiss Davis (OSU) presented HICO applications for assessing rivers, river plumes, lakes and estuaries.
  • In terms of image processing techniques, Marcos Montes (NRL) summarized the requirements and techniques for improved geolocation, ZhongPing Lee (UMass Boston) presented a methodology for atmospheric correction using cloud shadows, and Curtiss Davis (OSU) discussed various aspects of calibration and atmospheric correction.
  • James Goodman (HySpeed Computing) presented an overview of the functionality and capabilities of the HICO Online Processing Tool, a prototype web-enabled, scalable, geospatial data processing system based on the ENVI Services Engine. The tool is scheduled for release later this year, at which time it will be openly available to the science community for testing and evaluation.

Interested in more information? The meeting agenda and copies of presentations are provided on the OSU HICO website.

About HICO (http://hico.coas.oregonstate.edu/): “The Hyperspectral Imager for the Coastal Ocean (HICO™) is an imaging spectrometer based on the PHILLS airborne imaging spectrometers. HICO is the first spaceborne imaging spectrometer designed to sample the coastal ocean. HICO samples selected coastal regions at 90 m with full spectral coverage (380 to 960 nm sampled at 5.7 nm) and a very high signal-to-noise ratio to resolve the complexity of the coastal ocean. HICO demonstrates coastal products including water clarity, bottom types, bathymetry and on-shore vegetation maps. Each year HICO collects approximately 2000 scenes from around the world. The current focus is on providing HICO data for scientific research on coastal zones and other regions around the world. To that end we have developed this website and we will make data available to registered HICO Data Users who wish to work with us as a team to exploit these data.”

Visualizing HICO Ground Tracks Using Google Earth – A useful tool for project planning

Do you work with HICO imagery? Are you planning a project using HICO? Or perhaps you’re just interested in exploring where HICO will be acquiring imagery in the coming days?

If so, be sure to check out the ISS Orbit tool on the HICO website at Oregon State University. This tool allows you to interactively visualize the location of HICO ground track locations using Google Earth.

HICO ISS Orbit tool

The tool shows predicted HICO ground tracks in selected 1- or 3-day intervals up to six months in the future. However, even though orbital files are updated regularly, because of uncertainties in future ISS orbit specifics, the prediction is most accurate 2-3 days into the future and declines thereafter. So be cautious when planning fieldwork or image acquisitions for any extended time period.

For more information on ISS orbits characteristics, visit the NASA Space Station Orbit tutorial.

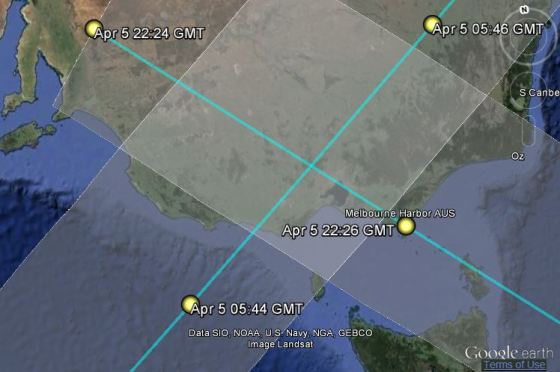
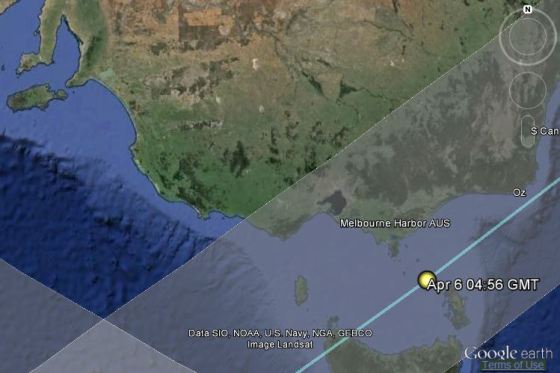
The ground tracks are displayed only for local daylight hours, and illustrate the nominal ground track (shown in teal above) as well as the full width available using HICO’s pointing capabilities (shown in grey above). Users have the option of also displaying the place names and locations of scheduled target areas for both ascending and descending orbits. Additionally, as the zoom level is increased, yellow dots appear in the visualization indicating the predicted time and date the ISS will pass over that location.

The HICO ISS Orbit tool requires the Google Earth plugin, which is available in Chrome, Firefox and IE (note that IE users may need to add the oregonstate.edu website to Compatibility View in the tool settings).

Let’s look at an example. Say you’re interested in exploring when HICO will be available to acquire imagery of Melbourne Harbor from April 5-11. Using the tool to step through the ISS orbits for those dates, it is revealed that Melbourne Harbor can be acquired on April 5 @ 22:26 and 5:45 GMT, April 6 @ 4:56 GMT and April 9 @ 4:05.

HICO Melbourne Harbor 040514

ISS Orbit tool: HICO – Melbourne Harbor 5-April-2014

HICO Melbourne Harbor 040614

ISS Orbit tool: HICO – Melbourne Harbor 6-April-2014

HICO Melbourne Harbor 040914

ISS Orbit tool: HICO – Melbourne Harbor 9-April-2014

Now let’s extend this example to see if Hyperion data is also available for Melbourne Harbor for the same dates. To do so, you will need to utilize COVE, a similar tool (best in Chrome or Firefox) with robust capabilities for visualizing ground tracks of numerous Earth observing satellites (but unfortunately not HICO or any other instruments on the ISS). Visit our earlier post for an overview of COVE’s capabilities.

Using COVE, it can be seen that Hyperion data is available for acquisition of Melbourne Harbor on April 9 @ 23:16 GMT. This closely coincident acquisition opportunity might provide some interesting data for comparing hyperspectral analysis techniques using HICO and Hyperion.

Hyperion Melbourne Harbor 040914

COVE tool: Hyperion – Melbourne Harbor 5-April-2014

So be sure to check out both the COVE and HICO ISS Orbit tools when planning your next mission.

HICO ISS Orbit tool: http://hico.coas.oregonstate.edu/orbit/orbit.php

COVE: http://www.ceos-cove.org/

About HICO (http://hico.coas.oregonstate.edu/): “The Hyperspectral Imager for the Coastal Ocean (HICO™) is an imaging spectrometer based on the PHILLS airborne imaging spectrometers. HICO is the first spaceborne imaging spectrometer designed to sample the coastal ocean. HICO samples selected coastal regions at 90 m with full spectral coverage (380 to 960 nm sampled at 5.7 nm) and a very high signal-to-noise ratio to resolve the complexity of the coastal ocean. HICO demonstrates coastal products including water clarity, bottom types, bathymetry and on-shore vegetation maps. Each year HICO collects approximately 2000 scenes from around the world. The current focus is on providing HICO data for scientific research on coastal zones and other regions around the world. To that end we have developed this website and we will make data available to registered HICO Data Users who wish to work with us as a team to exploit these data.”

About Hyperion (http://eo1.gsfc.nasa.gov/ and http://eo1.usgs.gov/): “The Hyperion instrument provides a new class of Earth observation data for improved Earth surface characterization. The Hyperion provides a science grade instrument with quality calibration based on heritage from the LEWIS Hyperspectral Imaging Instrument (HSI). The Hyperion capabilities provide resolution of surface properties into hundreds of spectral bands versus the ten multispectral bands flown on traditional Landsat imaging missions. Through these spectral bands, complex land eco-systems can be imaged and accurately classified.The Hyperion provides a high resolution hyperspectral imager capable of resolving 220 spectral bands [from 400 to 2500 nm] with a 30-meter resolution. The instrument can image a 7.5 km by 100 km land area per image, and provide detailed spectral mapping across all 220 channels with high radiometric accuracy.”

Remote Sensing Archives – An overview of online resources for lidar data

Previous posts on data access have focused on general resources for obtaining remote sensing imagery – Getting your hands on all that imagery – and specific resources related to imaging spectrometry – A review of online resources for hyperspectral imagery. To add to this compendium of data resources, the following includes an overview of online archives for lidar data.

USGS lidar Mount St Helens

Lidar image of Mount St. Helens (courtesy USGS)

Lidar (light detection and ranging), also commonly referred to as LiDAR or LIDAR, is an “active” remote sensing technology, whereby laser pulses are used to illuminate a surface and the reflected return signals from these pulses are used to indicate the range (distance) to that surface. When combined with positional information and other data recorded by the airborne system, lidar produces a three-dimensional representation of the surface and the objects on that surface. Lidar technology can be utilized for terrestrial applications, e.g. topography, vegetation canopy height and infrastructure surveys, as well as aquatic applications, e.g. bathymetry and coastal geomorphology.

Below is an overview of archives that contain lidar data products and resources:

  • CLICK (Center for LIDAR Information Coordination and Knowledge) provides links to different publically available USGS lidar resources, including EAARL, the National Elevation Dataset and EarthExplorer. The CLICK website also hosts a searchable database of lidar publications and an extensive list of links to relevant websites for companies and academic institutions using lidar data in their work.
  • EAARL (Experimental Advanced Airborne Research Lidar) is an airborne sensor system that has the capacity to seamlessly measure both submerged bathymetric surfaces and adjacent terrestrial topography. By selecting the “Data” tab on the EAARL website, and then following links to specific surveys, users can view acquisition areas using Google Maps and access data as ASCII xyz files, GeoTIFFs and LAS files (a standardized lidar data exchange format).
  • NED (National Elevation Dataset) is the USGS seamless elevation data product for the United States and its territorial islands. NED is compiled using the best available data for any given area, where the highest resolution and most accurate of which is derived from lidar data and digital photogrammetry. NED data are available through the National Map Viewer in a variety of formats, including ArcGRID, GeoTIFF, BIL and GridFloat. However, to access the actual lidar data, and not just the resulting integrated products, users need to visit EarthExplorer.
  • EarthExplorer is a consolidated data discovery portal for the USGS data archives, which includes airborne and satellite imagery, as well as various derived image products. EarthExplorer allows users to search by geographic area, date range, feature class and data type, and in most cases instantly download selected data. To access lidar data, which are provided as LAS files, simply select the lidar checkbox under the Data Sets tab as part of your search criteria.
  • JALBTCX (Joint Airborne Lidar Bathymetry Technical Center of Expertise) performs data collection and processing for the U.S. Army Corps of Engineers, the U.S. Naval Meteorology and Oceanography Command and NOAA. The JALBTCX website includes a list of relevant lidar publications, a description of the National Coastal Mapping Program, and a link to data access via NOAA’s Digital Coast.
  • Digital Coast is a service provided by NOAA’s Coastal Services Center that integrates coastal data accessibility with software tools, technology training and success stories. Of the 950 data layers currently listed in the Digital Coast archive, lidar data represents nearly half of the available products. Searching for lidar data can be achieved using the Data Access Viewer and selecting “elevation” as the data type in your search, or by following the “Data” tab on the Digital Coast home page and entering “lidar” for the search criteria. The data is available in a variety of data formats, including ASCII xyz, LAS, LAZ, GeoTIFF and ASCII Grid, among others.
  • NCALM (National Center for Airborne Laser Mapping) is a multi-university partnership funded by the U.S. National Science Foundation, whose mission is to provide community access to high quality lidar data and support scientific research in airborne laser mapping. Data is accessible through the OpenTopography portal, either in KML format for display in Google Earth, as pre-processed DEM products, or as lidar point clouds in ASCII and LAS formats.

Lidar can be useful on its own, e.g. topography and bathymetry, and can also be merged with other remote sensing data, such as multispectral and hyperspectral imagery, to provide valuable three-dimensional information as input for further analysis. For example, lidar derived bathymetry can be used as input to improve hyperspectral models of submerged environments in the coastal zone. There has also been more widespread use of full-waveform lidar, which provides increased capacity to discriminate surface characteristics and ground features, as well as increased use of lidar return intensity, which can be used to generate a grayscale image of the surface.

What is readily apparent is that as the technology continues to improve, data acquisition becomes more cost effective, and data availability increases, lidar will play an important role in more and more remote sensing investigations.